![]()
Regional activity time series visualizations
This example shows how to create visualizations of iNaturalist activity over time in a given region. See https://www.inaturalist.org/places to find place IDs.
Visualization are made using Altair, with the following metrics:
Number of observations
Number of taxa observed
Number of observers
Number of identifiers
from datetime import datetime

import altair as alt
import pandas as pd

from pyinaturalist import (
    get_interval_ranges,
    iNatClient,
)

# Create a client for API requests
client = iNatClient()

# Adjustable values
PLACE_ID = 6
PLACE_NAME = 'Alaska'
YEAR = 2020
Observations per year
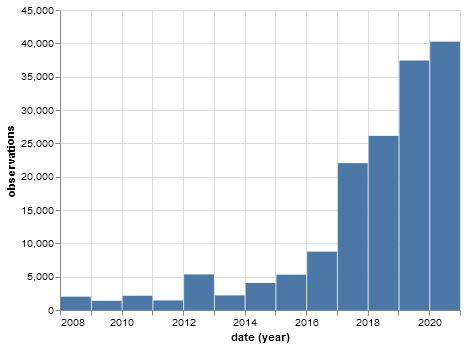
observations_by_year = client.observations.histogram(
    place_id=PLACE_ID,
    interval='year',
    d1='2008-01-01',
    d2=f'{YEAR}-12-31',
    verifiable=True,
)
observations_by_year_df = pd.DataFrame(
    [{'date': k, 'observations': v} for k, v in observations_by_year.raw.items()]
)

alt.Chart(observations_by_year_df).mark_bar().encode(x='year(date):T', y='observations:Q')
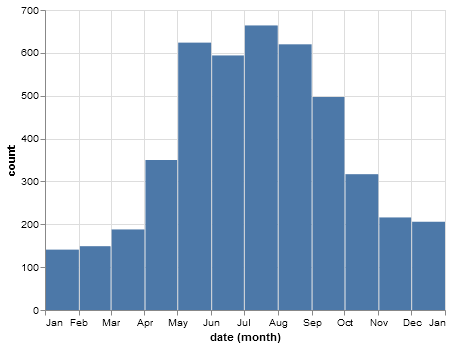
Observations per month
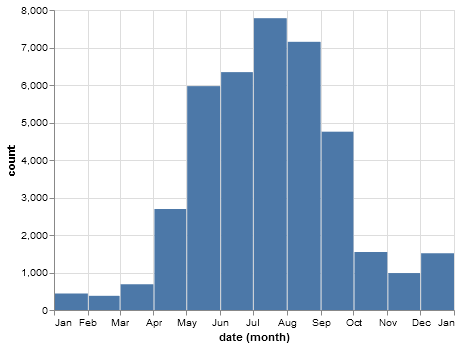
observations_by_month = client.observations.histogram(
    place_id=PLACE_ID,
    interval='month',
    d1='2020-01-02',
    d2='2020-12-31',
    verifiable=True,
)
observations_by_month_df = pd.DataFrame(
    [
        {'metric': 'Observations', 'date': k, 'count': v}
        for k, v in observations_by_month.raw.items()
    ]
)
alt.Chart(observations_by_month_df).mark_bar().encode(x='month(date):T', y='count:Q')
Histograms with custom metrics
The API does not have a histogram endpoint for taxa observed, observers, or identifiers, so we first need to determine our date ranges of interest, and then run one search per date range.
Here are a couple helper functions to make this easier:
def count_date_range_results(function_name, start_date, end_date):
    """Get the count of results for the given date range and controller method"""
    # Running this search with per_page=0 will (quickly) return only a count of results, not complete results
    controller = getattr(client.observations, function_name)
    paginator = controller(
        place_id=PLACE_ID,
        d1=start_date,
        d2=end_date,
        verifiable=True,
    )
    count = paginator.count()
    print(f'Total results for {start_date.strftime("%b")}: {count}')
    return count


def get_monthly_counts(function_name, label):
    """Get the count of results per month for the given controller method"""
    month_ranges = get_interval_ranges(datetime(YEAR, 1, 1), datetime(YEAR, 12, 31), 'month')
    counts_by_month = {
        start_date: count_date_range_results(function_name, start_date, end_date)
        for (start_date, end_date) in month_ranges
    }
    return pd.DataFrame(
        [{'metric': label, 'date': k, 'count': v} for k, v in counts_by_month.items()]
    )
Unique taxa observed per month
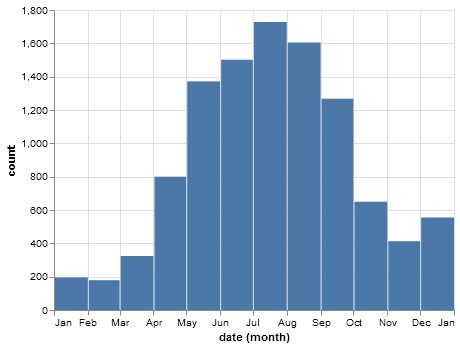
taxa_by_month = get_monthly_counts('species_counts', 'Taxa')
alt.Chart(taxa_by_month).mark_bar().encode(x='month(date):T', y='count:Q')
Observers per month
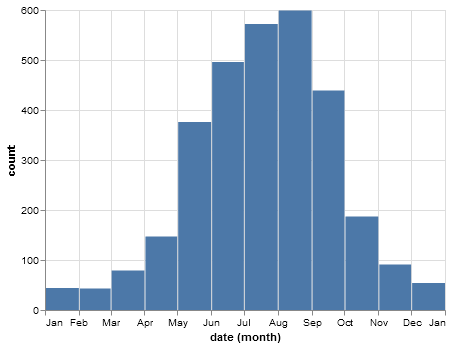
observers_by_month = get_monthly_counts('observers', 'Observers')
alt.Chart(observers_by_month).mark_bar().encode(x='month(date):T', y='count:Q')
Identifiers per month
identifiers_by_month = get_monthly_counts('identifiers', 'Identifiers')
alt.Chart(identifiers_by_month).mark_bar().encode(x='month(date):T', y='count:Q')
Combine all monthly metrics into one plot
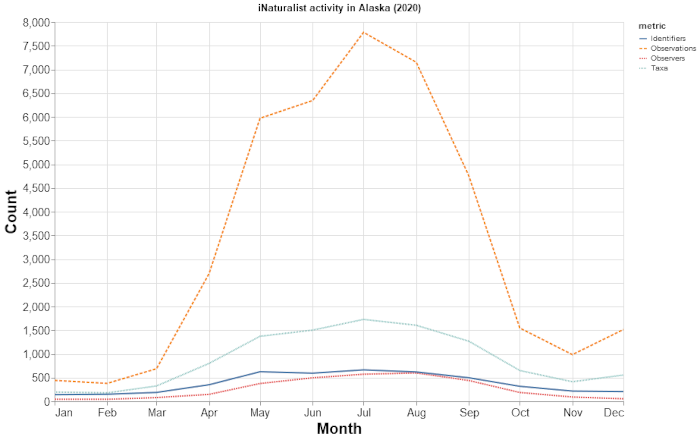
combined_results = pd.concat(
    [observations_by_month_df, taxa_by_month, observers_by_month, identifiers_by_month]
)

alt.Chart(
    combined_results,
    title=f'iNaturalist activity in {PLACE_NAME} ({YEAR})',
    width=750,
    height=500,
).mark_line().encode(
    alt.X('month(date):T', axis=alt.Axis(title='Month')),
    alt.Y('count:Q', axis=alt.Axis(title='Count')),
    color='metric',
    strokeDash='metric',
).configure_axis(
    labelFontSize=15,
    titleFontSize=20,
)