![]()
Regional observation stats
This example shows how to get some general statistics on all observations in a given region. See https://www.inaturalist.org/places to find place IDs.
import altair as alt
import pandas as pd

from pyinaturalist import (
    iNatClient,
)
from pyinaturalist.constants import ICONIC_TAXA

# Create a client for API requests
client = iNatClient()

# Adjustable values
PLACE_ID = 6
PLACE_NAME = 'Alaska'
General stats
Total observations, unique taxa, identifiers, and observers
total_observations = client.observations.search(
    place_id=PLACE_ID,
    verifiable=True,
).count()
print(f'Total observations: {total_observations}')

species_counts = client.observations.species_counts(
    place_id=PLACE_ID,
    verifiable=True,
)
print(f'Total taxa observed: {len(species_counts)}')

identifiers = client.observations.identifiers(place_id=PLACE_ID)
print(f'Total identifiers: {len(identifiers)}')

observers = client.observations.observers(place_id=PLACE_ID)
print(f'Total observers: {len(observers)}')
Total observations: 696947
Total taxa observed: 500
Total identifiers: 500
Total observers: 500
Stats by iconic taxon
Show a breakdown of observations and taxa observed for each of the iconic taxa (major species groups), using their corresponding icons on iNaturalist. Here are a couple helper functions to make this easier:
TAXON_IMAGE_URL = 'https://raw.githubusercontent.com/inaturalist/inaturalist/main/app/assets/images/iconic_taxa/{taxon}-75px.png'
iconic_taxa = list(ICONIC_TAXA.values())
iconic_taxa.remove('Unknown')
def get_iconic_icon(taxon_name):
return TAXON_IMAGE_URL.format(taxon=taxon_name.lower())
# Run one search for each iconic taxon
iconic_taxa_counts = {}
for taxon_name in iconic_taxa:
total_taxon_observations = client.observations.search(
place_id=PLACE_ID,
iconic_taxa=taxon_name,
verifiable=True,
).count()
iconic_taxa_counts[taxon_name] = total_taxon_observations
print(f'Total results for {taxon_name}: {total_taxon_observations}')
# Create a chart, sorted by number of observations, using the appropriate iNaturalist icons
observations_df = pd.DataFrame(
[
{'iconic taxon': k, 'observations': v, 'img': get_iconic_icon(k)}
for k, v in iconic_taxa_counts.items()
]
)
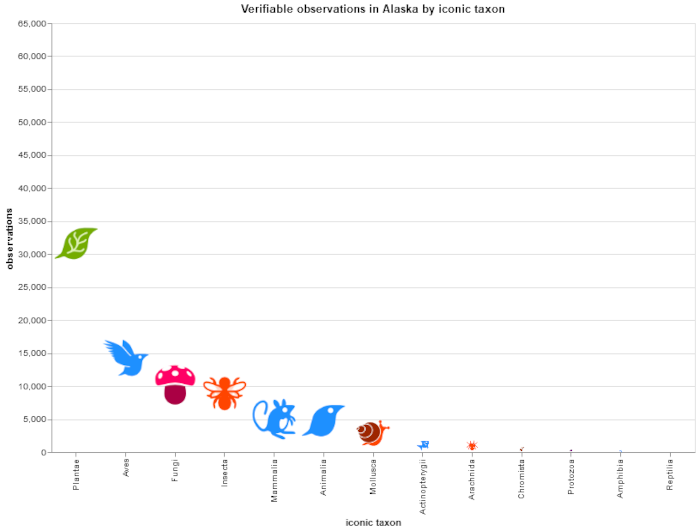
alt.Chart(
observations_df,
title=f'Verifiable observations in {PLACE_NAME} by iconic taxon',
width=750,
height=500,
).mark_image().encode(x=alt.X('iconic taxon:N', sort='-y'), y='observations:Q', url='img')
Observations
# Run one search for each iconic taxon
total_taxa_by_iconic_taxon = {}
for taxon_name in iconic_taxa:
total_taxon_observations = client.observations.search(
place_id=PLACE_ID,
iconic_taxa=taxon_name,
verifiable=True,
).count()
total_taxa_by_iconic_taxon[taxon_name] = total_taxon_observations
print(f'Total results for {taxon_name}: {total_taxon_observations}')
# Create a chart, sorted by number of observations, using the appropriate iNaturalist icons
taxa_df = pd.DataFrame(
[
{'iconic taxon': k, 'unique taxa': v, 'img': get_iconic_icon(k)}
for k, v in total_taxa_by_iconic_taxon.items()
]
)
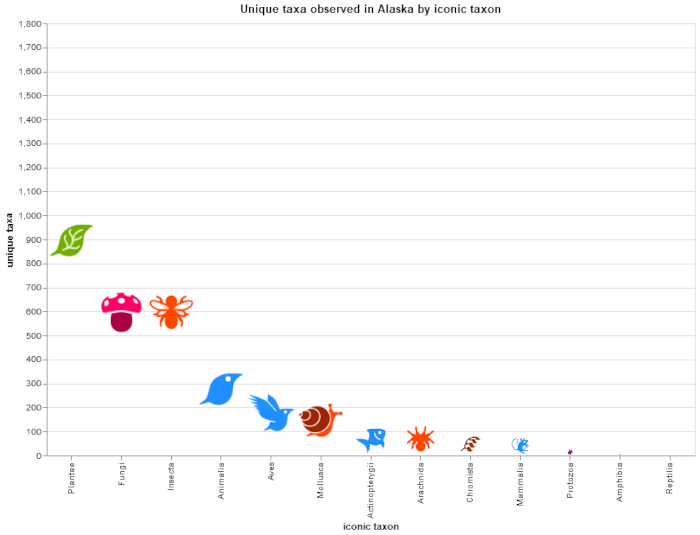
alt.Chart(
taxa_df,
title=f'Unique taxa observed in {PLACE_NAME} by iconic taxon',
width=750,
height=500,
).mark_image().encode(x=alt.X('iconic taxon:N', sort='-y'), y='unique taxa:Q', url='img')
Taxa